In May 2024, 32446, FL homes were selling for an average price of $101,617, 32446, FL homes on average sell after 26 days on the market compared to 45 days last year. There were 3 homes sold in 32446, FL for May 2024, compared to 3 last year.
The average list price of 32446, FL, was $155,379 in May 2024, compared to $0 in May 2023.
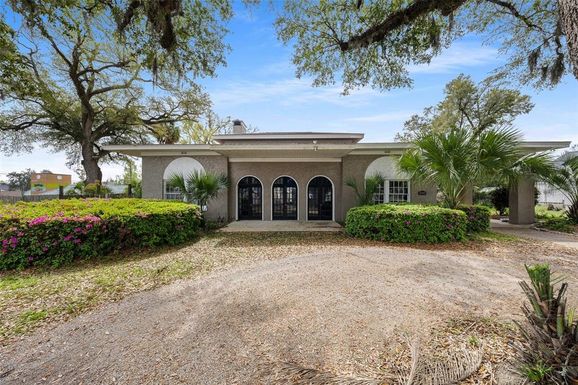
32446, FL Market Trend for Houses
Average List Price
The average list price of houses in 32446, FL, was $262,000 in May 2024, compared to $0 in May 2023.
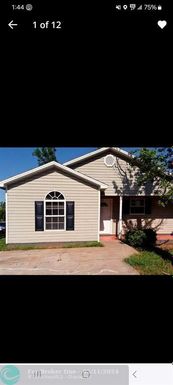
32446, FL Market Trend for Condos / Townhouses / Penthouses
Average List Price
The average list price of condos/co-ops in 32446, FL, was $0 in May 2024, compared to $0 in May 2023.
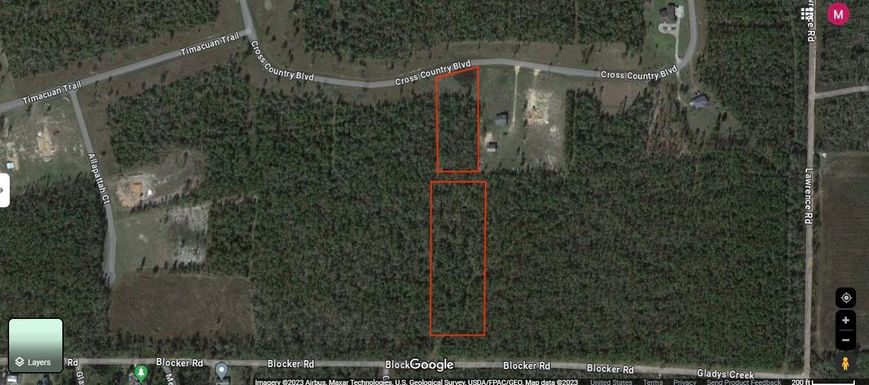
32446, FL Market Trend for Lots/Land
Average List Price
The average list price of lots/land in 32446, FL, was $27,995 in May 2024, compared to $0 in May 2023.
32446, FL Market Trend for Commercial
Average List Price
The average list price of commercial in 32446, FL, was $112,450 in May 2024, compared to $0 in May 2023.
32446, FL Housing Market Analysis
The average list price in 32446, FL is $155,379. The average list price in 32446, FL went up 455.02% from 2023 to 2024. 32446, FL home resale inventories is 5, which increased 400.00% since 2023. The average list price per square foot in 32446, FL is $117. 2023 it was $0.