In May 2024, Webster, FL homes were selling for an average price of $171,906, Webster, FL homes on average sell after 86 days on the market compared to 68 days last year. There were 320 homes sold in Webster, FL for May 2024, compared to 316 last year.
The average list price of Webster, FL, was $384,668 in May 2024, compared to $249,591 in May 2023.
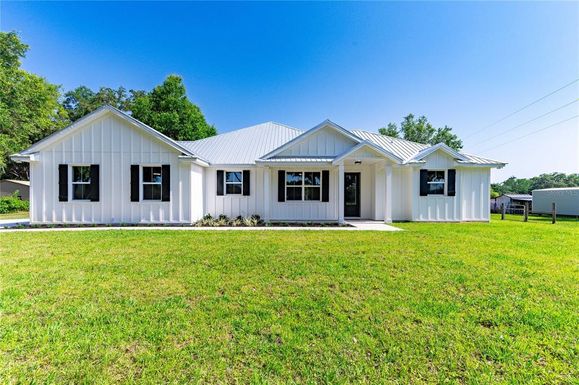
Webster, FL Market Trend for Houses
Average List Price
The average list price of houses in Webster, FL, was $440,760 in May 2024, compared to $425,471 in May 2023.
Webster, FL Market Trend for Condos / Townhouses / Penthouses
Average List Price
The average list price of condos/co-ops in Webster, FL, was $0 in May 2024, compared to $0 in May 2023.
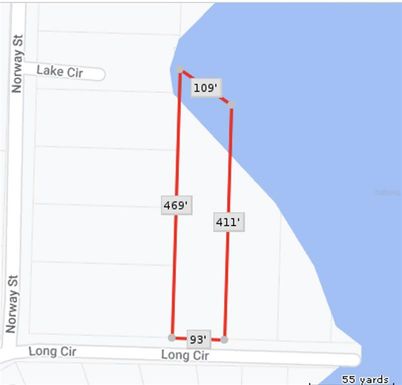
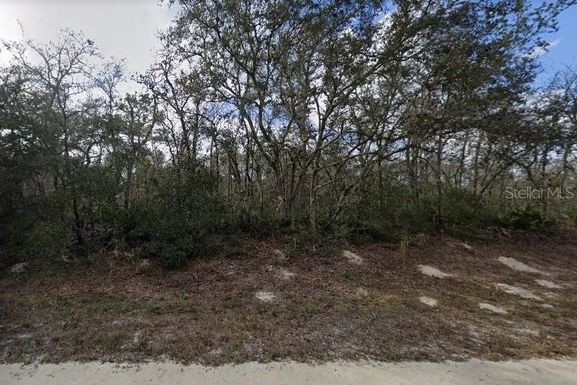
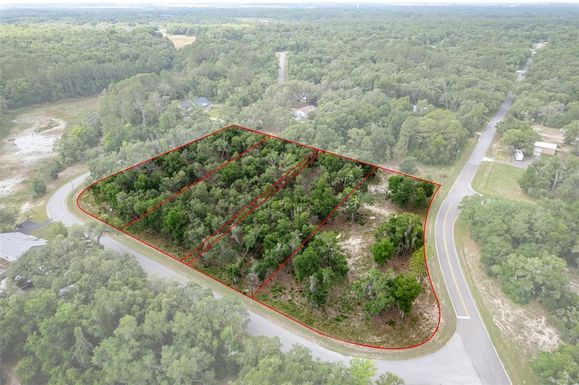
Webster, FL Market Trend for Lots/Land
Average List Price
The average list price of lots/land in Webster, FL, was $356,487 in May 2024, compared to $175,069 in May 2023.
Webster, FL Market Trend for Commercial
Average List Price
The average list price of commercial in Webster, FL, was $651,700 in May 2024, compared to $507,475 in May 2023.
Webster, FL Housing Market Analysis
The average list price in Webster, FL is $384,668. The average list price in Webster, FL went up 18.27% from 2023 to 2024. Webster, FL home resale inventories is 144, which increased 24.14% since 2023. The average list price per square foot in Webster, FL is $334. 2023 it was $267.