In May 2024, Sebring, FL homes were selling for an average price of $156,513, Sebring, FL homes on average sell after 94 days on the market compared to 77 days last year. There were 507 homes sold in Sebring, FL for May 2024, compared to 405 last year.
The average list price of Sebring, FL, was $181,949 in May 2024, compared to $137,909 in May 2023.
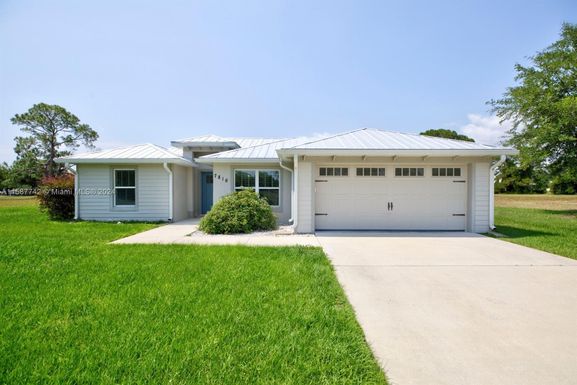
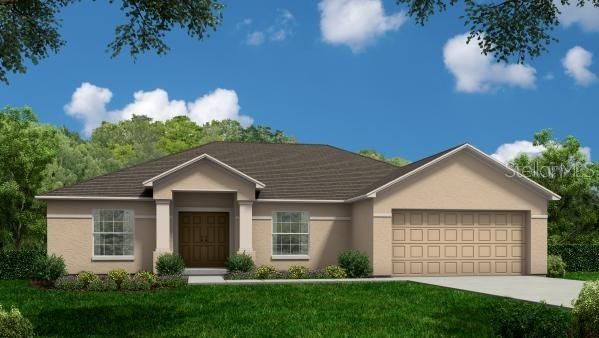
Sebring, FL Market Trend for Houses
Average List Price
The average list price of houses in Sebring, FL, was $351,657 in May 2024, compared to $321,556 in May 2023.
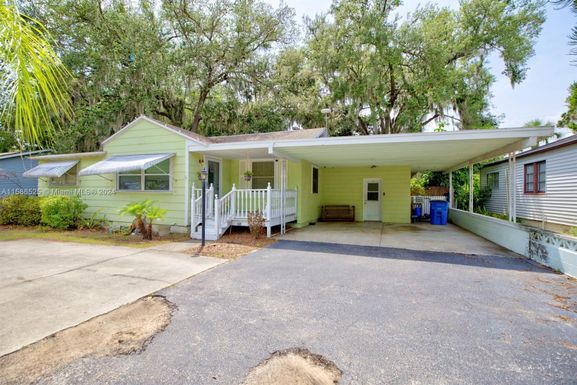
Sebring, FL Market Trend for Condos / Townhouses / Penthouses
Average List Price
The average list price of condos/co-ops in Sebring, FL, was $201,038 in May 2024, compared to $94,900 in May 2023.
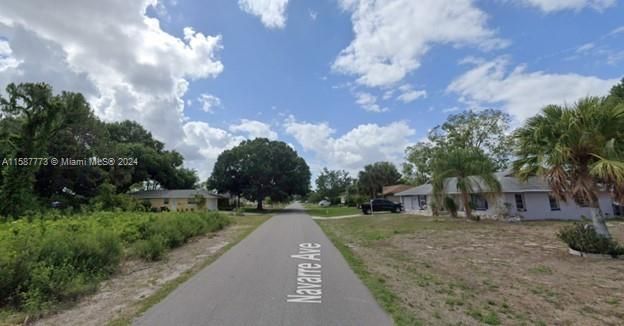
Sebring, FL Market Trend for Lots/Land
Average List Price
The average list price of lots/land in Sebring, FL, was $95,964 in May 2024, compared to $42,574 in May 2023.
Sebring, FL Market Trend for Commercial
Average List Price
The average list price of commercial in Sebring, FL, was $133,502 in May 2024, compared to $172,941 in May 2023.
Sebring, FL Housing Market Analysis
The average list price in Sebring, FL is $181,949. The average list price in Sebring, FL went up 19.17% from 2023 to 2024. Sebring, FL home resale inventories is 498, which increased 155.38% since 2023. The average list price per square foot in Sebring, FL is $184. 2023 it was $230.