In May 2024, Osteen, FL homes were selling for an average price of $392,235, Osteen, FL homes on average sell after 56 days on the market compared to 49 days last year. There were 101 homes sold in Osteen, FL for May 2024, compared to 76 last year.
The average list price of Osteen, FL, was $395,962 in May 2024, compared to $444,627 in May 2023.
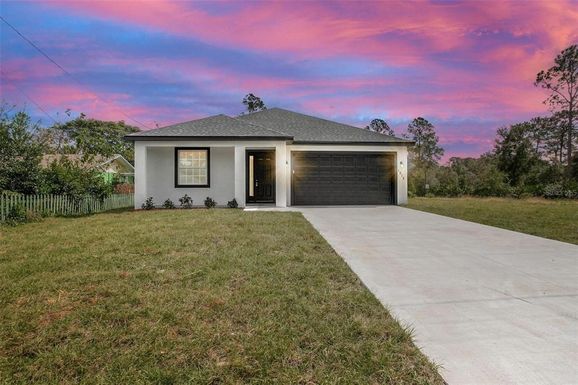
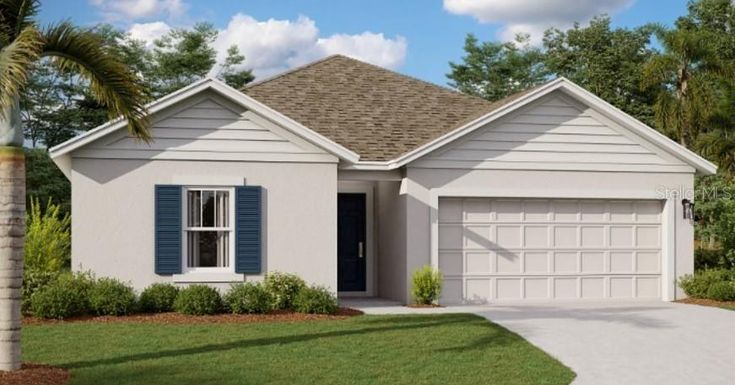
Osteen, FL Market Trend for Houses
Average List Price
The average list price of houses in Osteen, FL, was $568,949 in May 2024, compared to $604,074 in May 2023.
Osteen, FL Market Trend for Condos / Townhouses / Penthouses
Average List Price
The average list price of condos/co-ops in Osteen, FL, was $0 in May 2024, compared to $0 in May 2023.
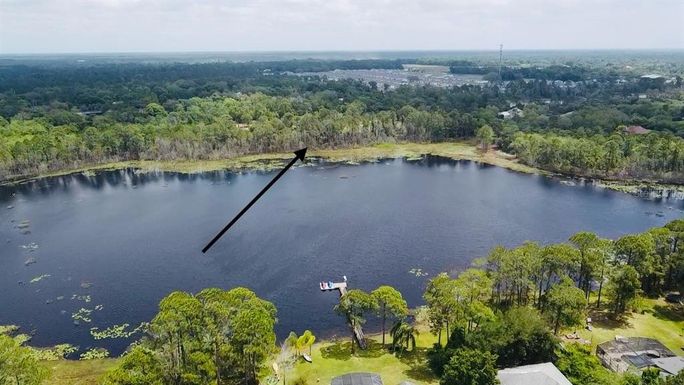
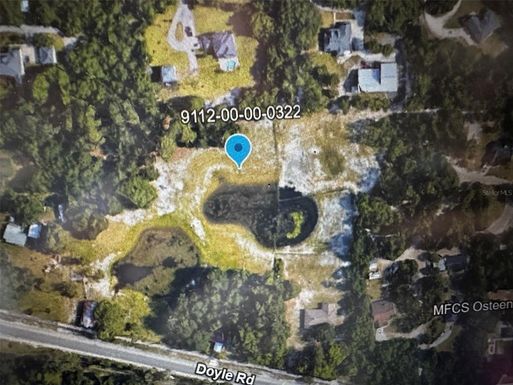
Osteen, FL Market Trend for Lots/Land
Average List Price
The average list price of lots/land in Osteen, FL, was $310,764 in May 2024, compared to $283,390 in May 2023.
Osteen, FL Market Trend for Commercial
Average List Price
The average list price of commercial in Osteen, FL, was $594,000 in May 2024, compared to $0 in May 2023.
Osteen, FL Housing Market Analysis
The average list price in Osteen, FL is $395,962. The average list price in Osteen, FL went down 15.62% from 2023 to 2024. Osteen, FL home resale inventories is 33, which increased 50.00% since 2023. The average list price per square foot in Osteen, FL is $244. 2023 it was $295.