In May 2024, Oldsmar, FL homes were selling for an average price of $452,517, Oldsmar, FL homes on average sell after 36 days on the market compared to 27 days last year. There were 398 homes sold in Oldsmar, FL for May 2024, compared to 426 last year.
The average list price of Oldsmar, FL, was $502,171 in May 2024, compared to $432,654 in May 2023.
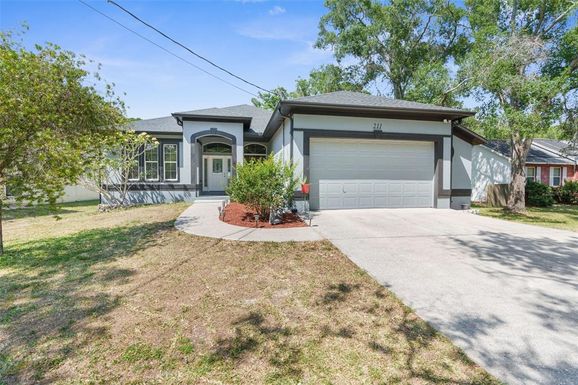
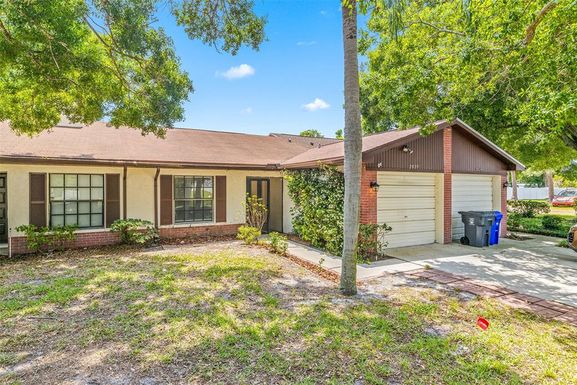
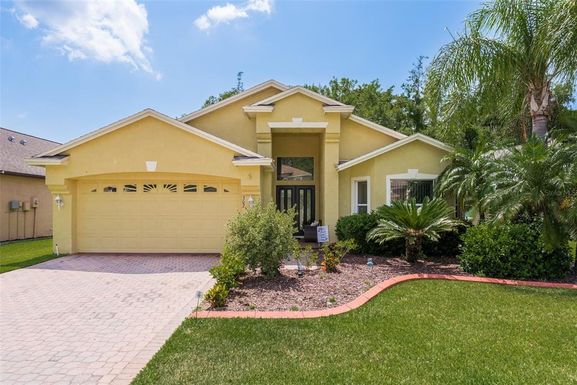
Oldsmar, FL Market Trend for Houses
Average List Price
The average list price of houses in Oldsmar, FL, was $667,969 in May 2024, compared to $497,703 in May 2023.
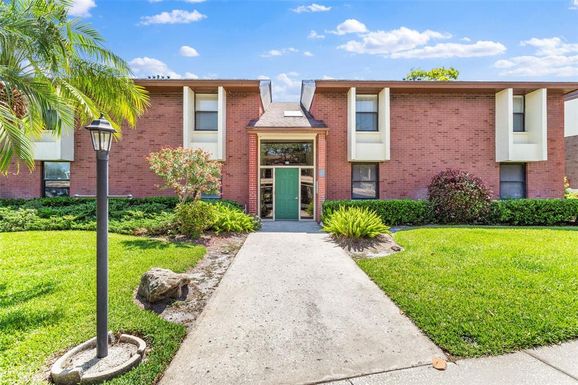
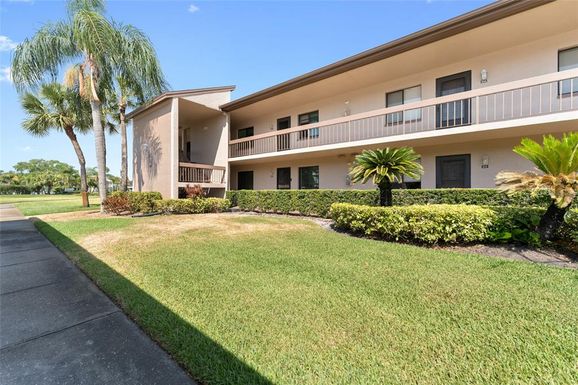
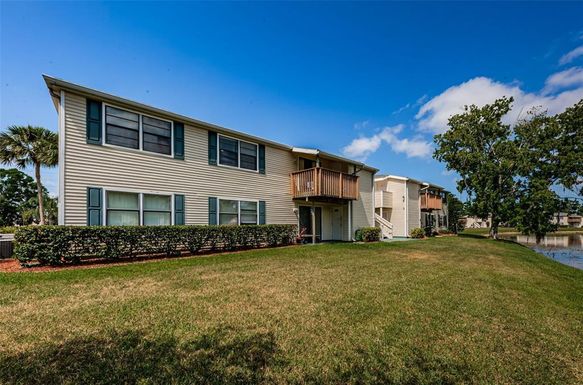
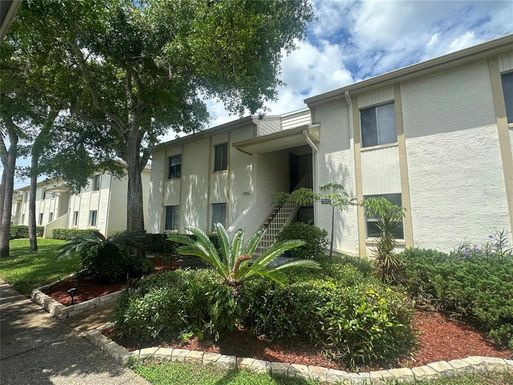
Oldsmar, FL Market Trend for Condos / Townhouses / Penthouses
Average List Price
The average list price of condos/co-ops in Oldsmar, FL, was $321,273 in May 2024, compared to $322,888 in May 2023.
Oldsmar, FL Market Trend for Lots/Land
Average List Price
The average list price of lots/land in Oldsmar, FL, was $633,227 in May 2024, compared to $632,829 in May 2023.
Oldsmar, FL Market Trend for Commercial
Average List Price
The average list price of commercial in Oldsmar, FL, was $546,713 in May 2024, compared to $350,000 in May 2023.
Oldsmar, FL Housing Market Analysis
The average list price in Oldsmar, FL is $502,171. The average list price in Oldsmar, FL went up 15.77% from 2023 to 2024. Oldsmar, FL home resale inventories is 128, which increased 60.00% since 2023. The average list price per square foot in Oldsmar, FL is $267. 2023 it was $263.