In May 2024, Ocala, FL homes were selling for an average price of $289,149, Ocala, FL homes on average sell after 73 days on the market compared to 55 days last year. There were 9084 homes sold in Ocala, FL for May 2024, compared to 7958 last year.
The average list price of Ocala, FL, was $388,278 in May 2024, compared to $367,847 in May 2023.
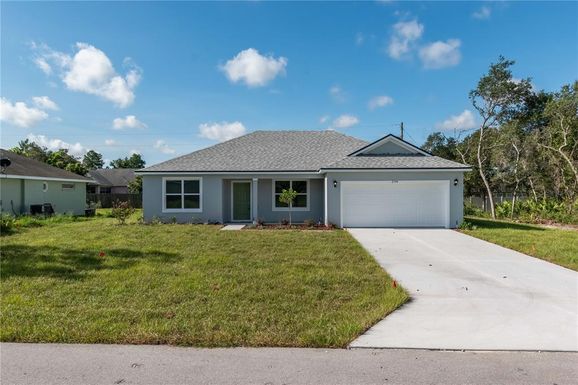
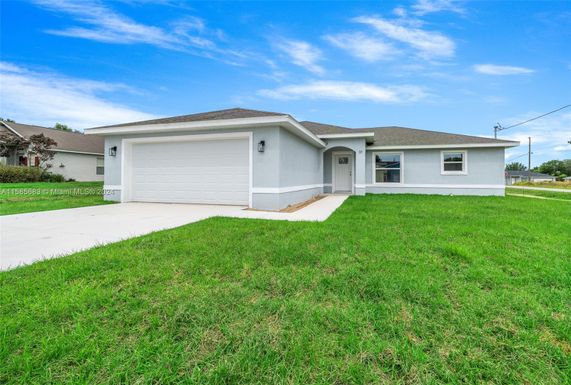
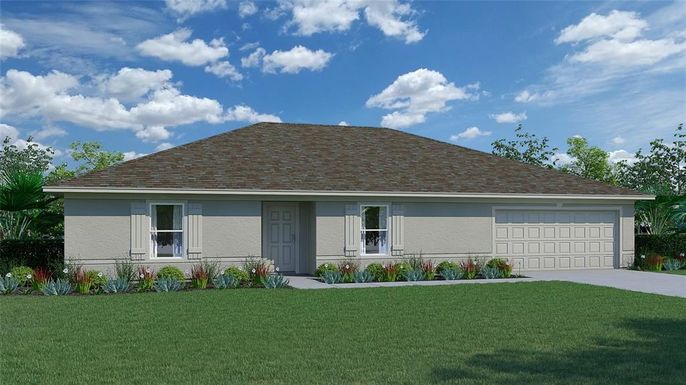
Ocala, FL Market Trend for Houses
Average List Price
The average list price of houses in Ocala, FL, was $379,377 in May 2024, compared to $335,911 in May 2023.
Ocala, FL Market Trend for Condos / Townhouses / Penthouses
Average List Price
The average list price of condos/co-ops in Ocala, FL, was $230,911 in May 2024, compared to $200,819 in May 2023.
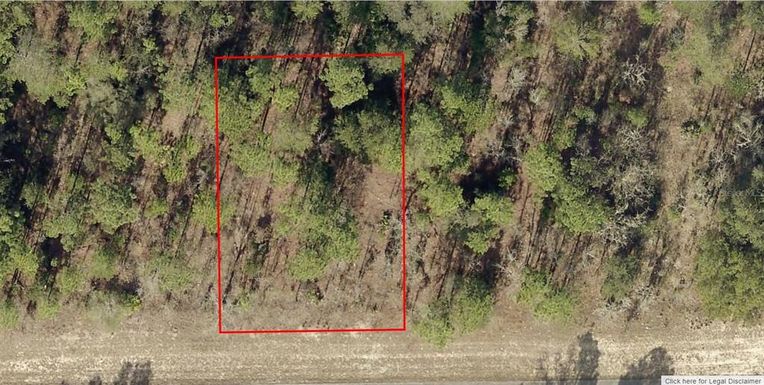
Ocala, FL Market Trend for Lots/Land
Average List Price
The average list price of lots/land in Ocala, FL, was $319,448 in May 2024, compared to $223,699 in May 2023.
Ocala, FL Market Trend for Commercial
Average List Price
The average list price of commercial in Ocala, FL, was $560,096 in May 2024, compared to $558,869 in May 2023.
Ocala, FL Housing Market Analysis
The average list price in Ocala, FL is $388,278. The average list price in Ocala, FL went up 5.68% from 2023 to 2024. Ocala, FL home resale inventories is 3226, which increased 10.29% since 2023. The average list price per square foot in Ocala, FL is $209. 2023 it was $186.