In May 2024, Oakland, FL homes were selling for an average price of $474,787, Oakland, FL homes on average sell after 49 days on the market compared to 43 days last year. There were 968 homes sold in Oakland, FL for May 2024, compared to 954 last year.
The average list price of Oakland, FL, was $626,890 in May 2024, compared to $608,875 in May 2023.
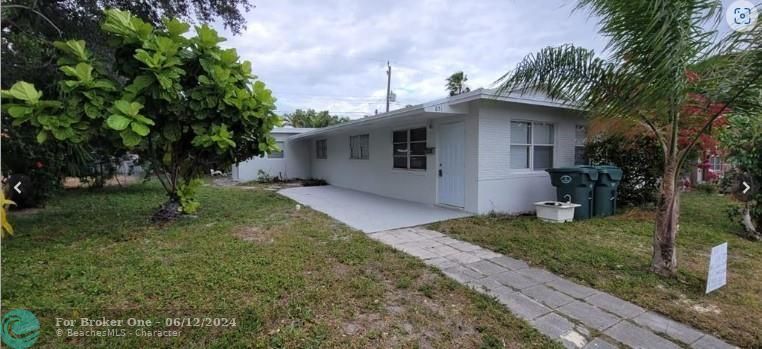
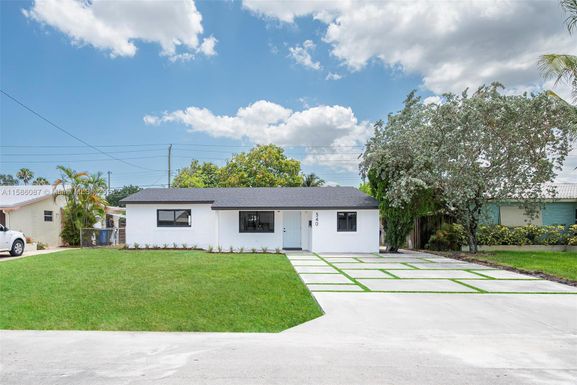
Oakland, FL Market Trend for Houses
Average List Price
The average list price of houses in Oakland, FL, was $746,551 in May 2024, compared to $715,883 in May 2023.
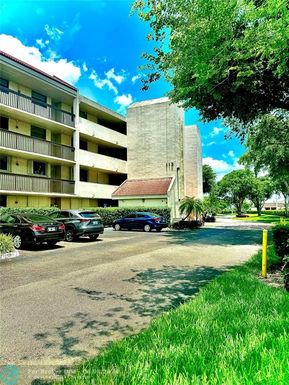
Oakland, FL Market Trend for Condos / Townhouses / Penthouses
Average List Price
The average list price of condos/co-ops in Oakland, FL, was $267,343 in May 2024, compared to $284,737 in May 2023.
Oakland, FL Market Trend for Lots/Land
Average List Price
The average list price of lots/land in Oakland, FL, was $822,806 in May 2024, compared to $834,375 in May 2023.
Oakland, FL Market Trend for Commercial
Average List Price
The average list price of commercial in Oakland, FL, was $1,848,432 in May 2024, compared to $1,167,569 in May 2023.
Oakland, FL Housing Market Analysis
The average list price in Oakland, FL is $626,890. The average list price in Oakland, FL went up 9.72% from 2023 to 2024. Oakland, FL home resale inventories is 425, which increased 83.19% since 2023. The average list price per square foot in Oakland, FL is $351. 2023 it was $352.