In May 2024, Middleburg, FL homes were selling for an average price of $308,050, Middleburg, FL homes on average sell after 48 days on the market compared to 109 days last year. There were 28 homes sold in Middleburg, FL for May 2024, compared to 24 last year.
The average list price of Middleburg, FL, was $332,406 in May 2024, compared to $318,500 in May 2023.
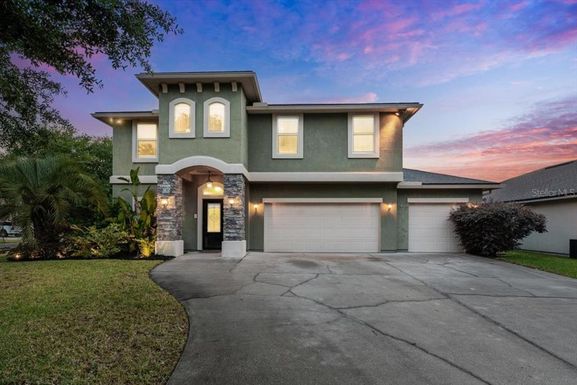
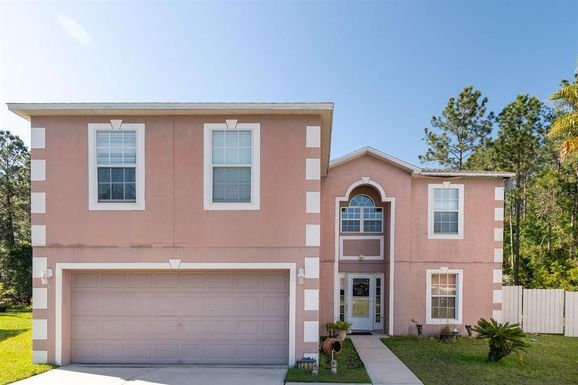
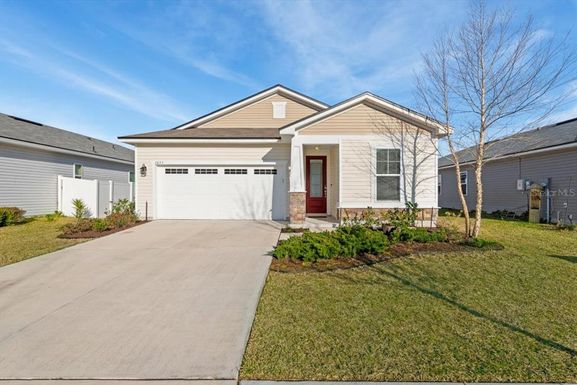
Middleburg, FL Market Trend for Houses
Average List Price
The average list price of houses in Middleburg, FL, was $380,254 in May 2024, compared to $430,360 in May 2023.
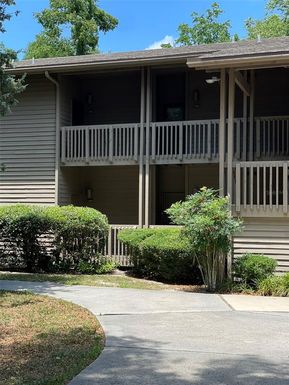
Middleburg, FL Market Trend for Condos / Townhouses / Penthouses
Average List Price
The average list price of condos/co-ops in Middleburg, FL, was $125,900 in May 2024, compared to $0 in May 2023.
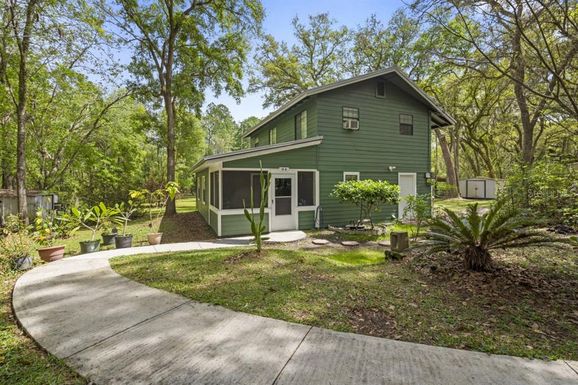
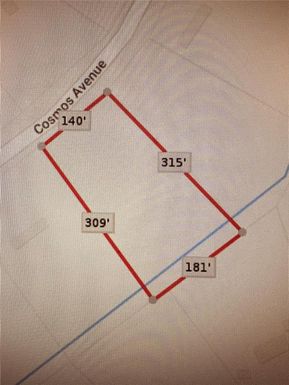
Middleburg, FL Market Trend for Lots/Land
Average List Price
The average list price of lots/land in Middleburg, FL, was $54,950 in May 2024, compared to $92,400 in May 2023.
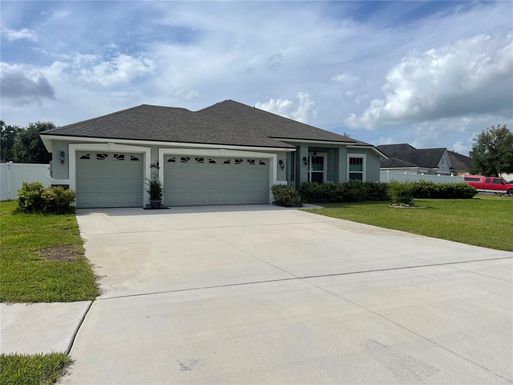
Middleburg, FL Market Trend for Commercial
Average List Price
The average list price of commercial in Middleburg, FL, was $449,950 in May 2024, compared to $0 in May 2023.
Middleburg, FL Housing Market Analysis
The average list price in Middleburg, FL is $332,406. The average list price in Middleburg, FL went up 6.01% from 2023 to 2024. Middleburg, FL home resale inventories is 16, which increased 60.00% since 2023. The average list price per square foot in Middleburg, FL is $193. 2023 it was $173.