In May 2024, Grant, FL homes were selling for an average price of $703,242, Grant, FL homes on average sell after 95 days on the market compared to 67 days last year. There were 26 homes sold in Grant, FL for May 2024, compared to 17 last year.
The average list price of Grant, FL, was $483,964 in May 2024, compared to $756,562 in May 2023.
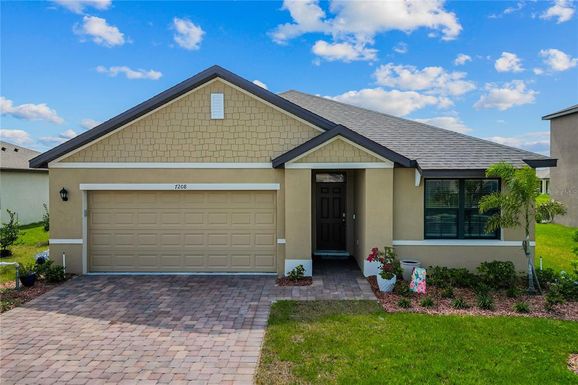
Grant, FL Market Trend for Houses
Average List Price
The average list price of houses in Grant, FL, was $805,071 in May 2024, compared to $961,083 in May 2023.
Grant, FL Market Trend for Condos / Townhouses / Penthouses
Average List Price
The average list price of condos/co-ops in Grant, FL, was $0 in May 2024, compared to $0 in May 2023.
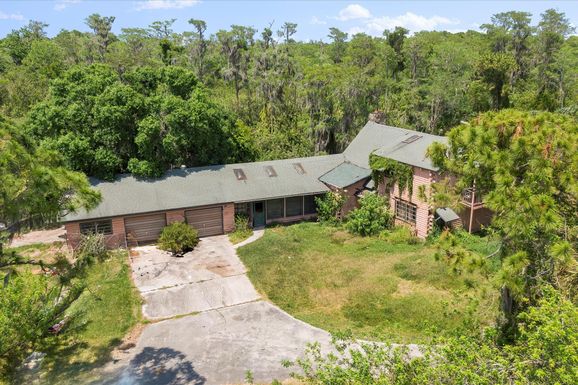
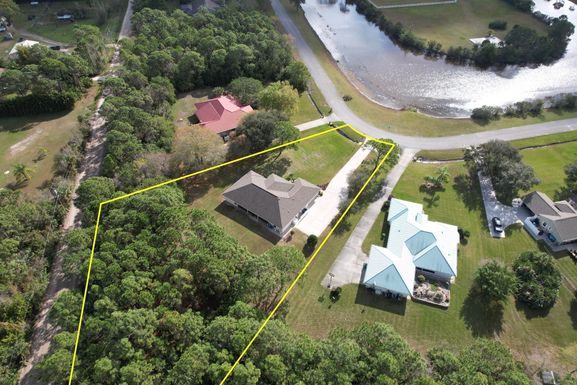
Grant, FL Market Trend for Lots/Land
Average List Price
The average list price of lots/land in Grant, FL, was $159,333 in May 2024, compared to $135,999 in May 2023.
Grant, FL Market Trend for Commercial
Average List Price
The average list price of commercial in Grant, FL, was $184,000 in May 2024, compared to $150,000 in May 2023.
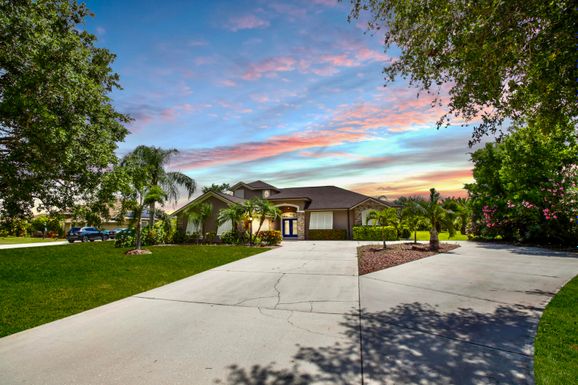
Grant, FL Housing Market Analysis
The average list price in Grant, FL is $483,964. The average list price in Grant, FL went down 42.60% from 2023 to 2024. Grant, FL home resale inventories is 14, which increased 100.00% since 2023. The average list price per square foot in Grant, FL is $365. 2023 it was $362.