In May 2024, Bradenton Beach, FL homes were selling for an average price of $1,211,453, Bradenton Beach, FL homes on average sell after 71 days on the market compared to 52 days last year. There were 64 homes sold in Bradenton Beach, FL for May 2024, compared to 67 last year.
The average list price of Bradenton Beach, FL, was $2,613,089 in May 2024, compared to $1,168,567 in May 2023.
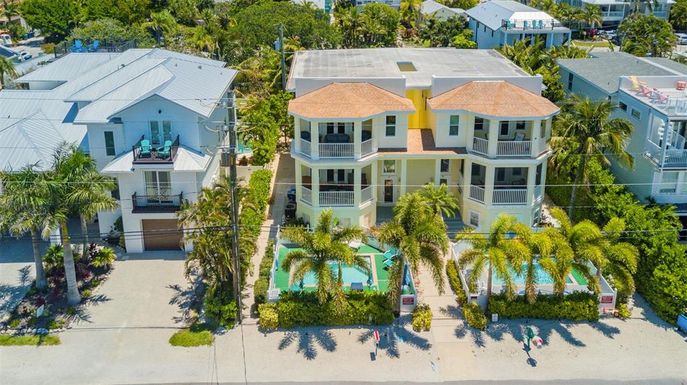
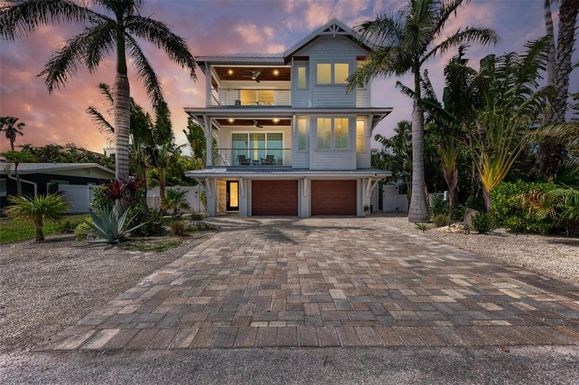
Bradenton Beach, FL Market Trend for Houses
Average List Price
The average list price of houses in Bradenton Beach, FL, was $4,687,404 in May 2024, compared to $2,355,822 in May 2023.
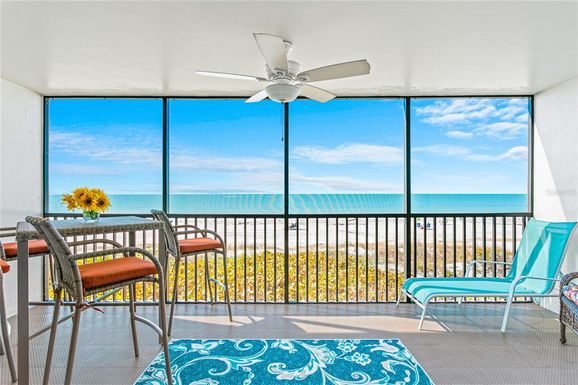
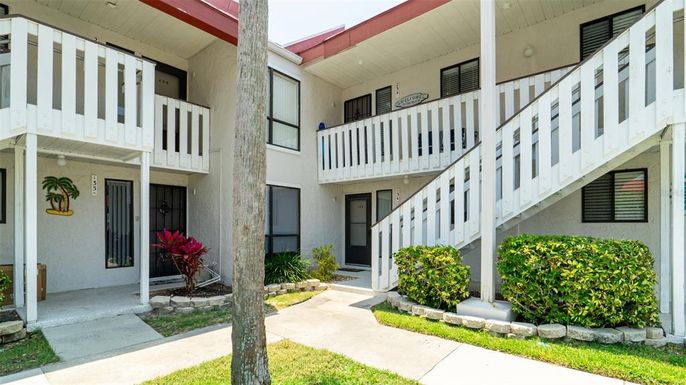
Bradenton Beach, FL Market Trend for Condos / Townhouses / Penthouses
Average List Price
The average list price of condos/co-ops in Bradenton Beach, FL, was $573,508 in May 2024, compared to $722,557 in May 2023.
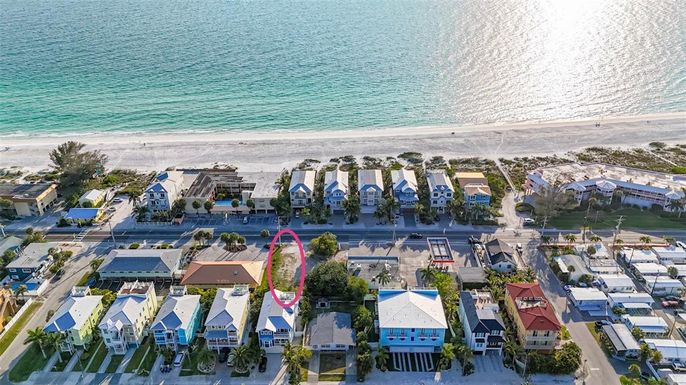
Bradenton Beach, FL Market Trend for Lots/Land
Average List Price
The average list price of lots/land in Bradenton Beach, FL, was $1,169,556 in May 2024, compared to $0 in May 2023.
Bradenton Beach, FL Market Trend for Commercial
Average List Price
The average list price of commercial in Bradenton Beach, FL, was $0 in May 2024, compared to $0 in May 2023.
Bradenton Beach, FL Housing Market Analysis
The average list price in Bradenton Beach, FL is $2,613,089. The average list price in Bradenton Beach, FL went up 125.67% from 2023 to 2024. Bradenton Beach, FL home resale inventories is 55, which increased 161.90% since 2023. The average list price per square foot in Bradenton Beach, FL is $1,081. 2023 it was $801.