In April 2024, 33133, FL homes were selling for an average price of $2,093,532, 33133, FL homes on average sell after 71 days on the market compared to 56 days last year. There were 543 homes sold in 33133, FL for April 2024, compared to 559 last year.
The average list price of 33133, FL, was $3,614,561 in April 2024, compared to $2,891,384 in April 2023.
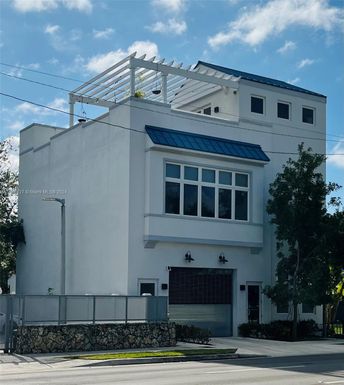
33133, FL Market Trend for Houses
Average List Price
The average list price of houses in 33133, FL, was $5,741,567 in April 2024, compared to $3,973,112 in April 2023.
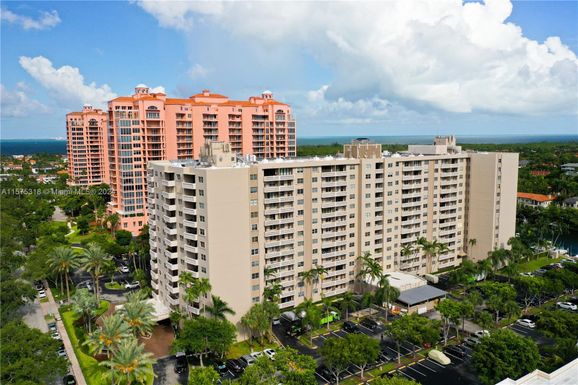
33133, FL Market Trend for Condos / Townhouses / Penthouses
Average List Price
The average list price of condos/co-ops in 33133, FL, was $2,393,215 in April 2024, compared to $2,556,962 in April 2023.
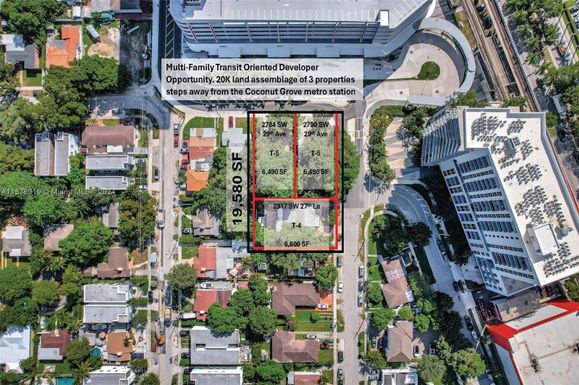
33133, FL Market Trend for Lots/Land
Average List Price
The average list price of lots/land in 33133, FL, was $2,728,621 in April 2024, compared to $2,456,709 in April 2023.
33133, FL Market Trend for Commercial
Average List Price
The average list price of commercial in 33133, FL, was $2,589,832 in April 2024, compared to $1,426,644 in April 2023.
33133, FL Housing Market Analysis
The average list price in 33133, FL is $3,614,561. The average list price in 33133, FL went up 23.68% from 2023 to 2024. 33133, FL home resale inventories is 350, which increased 90.22% since 2023. The average list price per square foot in 33133, FL is $1,162. 2023 it was $972.